
- 分享
-
收藏(0)
查看图片上下文
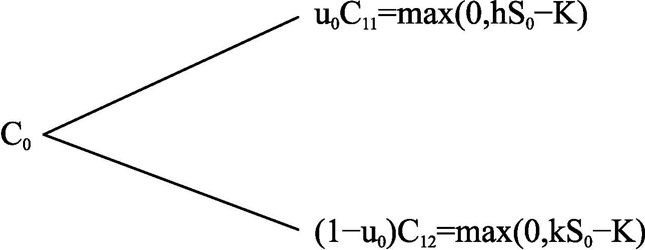
Figure 4 Single-period Option Price Chart
资源编号:1107717
图片出处:Frontiers in Economic and Management Research (Volume 5) 出处详情
关键词:
所属学科:管理学 经济学
图片描述:
图片规格:png
免费查看原图 查看全文
社会科学文献出版社版权所有
同文图片查看更多>
-
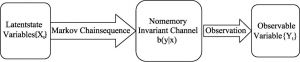
Figure 1 Presentation for the Relation between the Variables of Hidden Markov Process
图片出处:Frontiers in Economic and Management Research (Volume 5)
-

Figure 2 A Diagram of the Time Point Where the Market May Change
图片出处:Frontiers in Economic and Management Research (Volume 5)
-
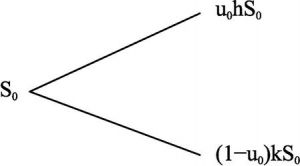
Figure 3 Single-phase Stock Price Chart
图片出处:Frontiers in Economic and Management Research (Volume 5)
-
图片出处:Frontiers in Economic and Management Research (Volume 5)
-

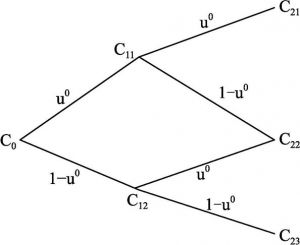
Figure 6.3 Price Chart of the Option When the Market Condition is Good in the Second Period
图片出处:Frontiers in Economic and Management Research (Volume 5)
