
- 分享
-
收藏(0)

查看图表上下文
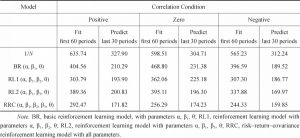
Figure 3 Participants’ Average Portfolios Represented by the Investments in Stock B and Bond C of the Three Conditions of Experiment No.1,Compared With the Average Predictions of the Basic Reinforcement (BR) Learning Model and the Risk-return-covariance (RRC) Model. The x-axes Represent the 90 Periods of the Whole Experiment Partitioned Into Nine Blocks of 10 Periods Each.
资源编号:1586030
图表出处:Frontiers in Economic and Management Research (Volume 7) 出处详情
关键词:
所属学科:国民经济计划学
图表描述:
图表规格:jpg
免费查看原图 查看全文
社会科学文献出版社版权所有
同文图表查看更多>
-
图表出处:Frontiers in Economic and Management Research (Volume 7)
-
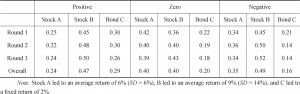
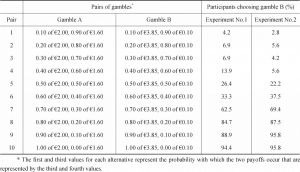
Table 3 Investments in the Three Assets Across the Three Correlation Conditions of Experiment No.1
图表出处:Frontiers in Economic and Management Research (Volume 7)
-
图表出处:Frontiers in Economic and Management Research (Volume 7)
-
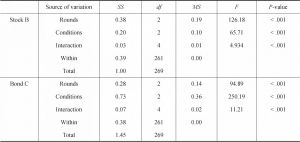
Table 8 Two Factor Repeated Measurement ANOVA of Experiment No.2
图表出处:Frontiers in Economic and Management Research (Volume 7)
-
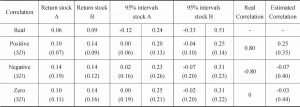
Table 10 Participants’ Estimations of the Two Stock Returns and Variability in Experiment No.2
图表出处:Frontiers in Economic and Management Research (Volume 7)
