
- 分享
-
收藏(0)
查看图表上下文
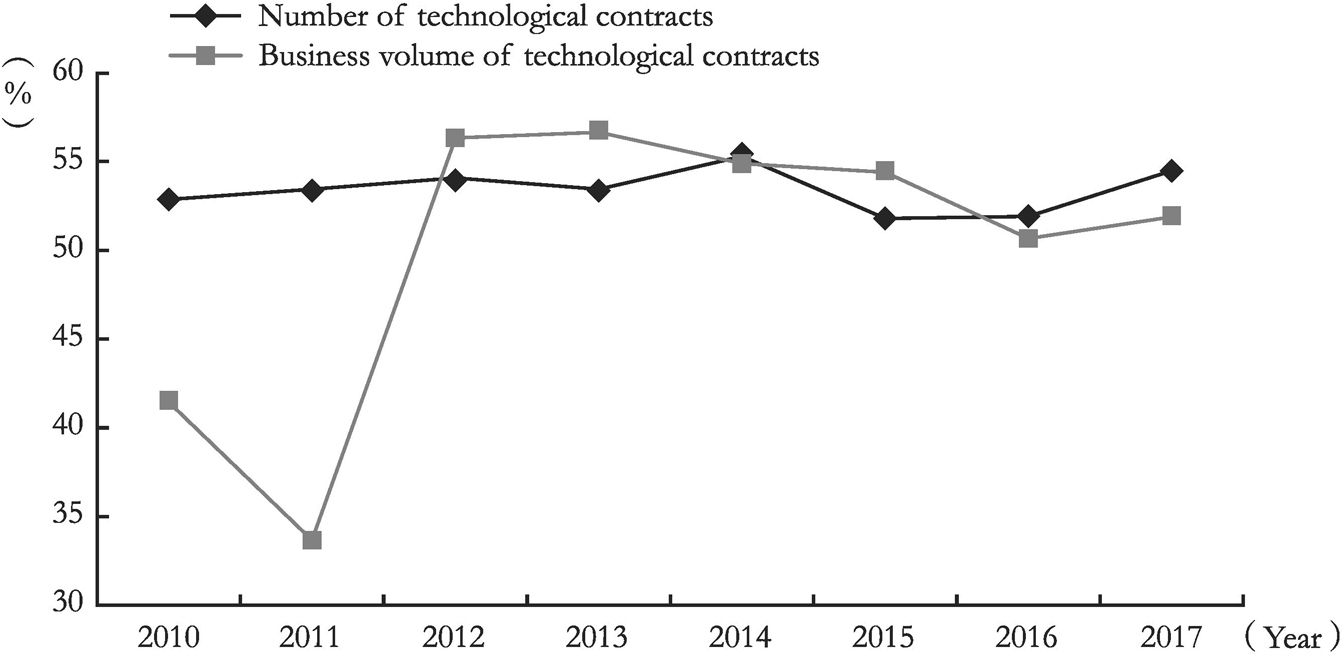
Figure 7 Number and Business Volume of Technological Contracts from Beijing to the Other Provinces (Municipalities and Autonomous Regions) for 2010-2017 as Percentages of the Total in Beijing
资源编号:1141445
图表出处:国家中心城市建设报告(2019):国家中心城市建设与区域协调发展(汉英对照)(全2册) 出处详情
关键词:
所属学科:城市经济学
图表描述:
图表规格:jpg
免费查看原图 查看全文
社会科学文献出版社版权所有
同文图表查看更多>
-

Table 3 Major Economic and Social Indicators of the Nine National Central Cities in 2018
图表出处:国家中心城市建设报告(2019):国家中心城市建设与区域协调发展(汉英对照)(全2册)
-
图表出处:国家中心城市建设报告(2019):国家中心城市建设与区域协调发展(汉英对照)(全2册)
-
图表出处:国家中心城市建设报告(2019):国家中心城市建设与区域协调发展(汉英对照)(全2册)
-
图表出处:国家中心城市建设报告(2019):国家中心城市建设与区域协调发展(汉英对照)(全2册)
-

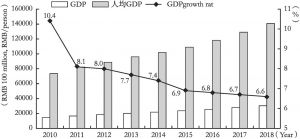
Figure 5 Numbers and Growth Rates of Residents and Migrants in Beijing for 2010-2018
图表出处:国家中心城市建设报告(2019):国家中心城市建设与区域协调发展(汉英对照)(全2册)
