
- 分享
-
收藏(0)
查看图表上下文
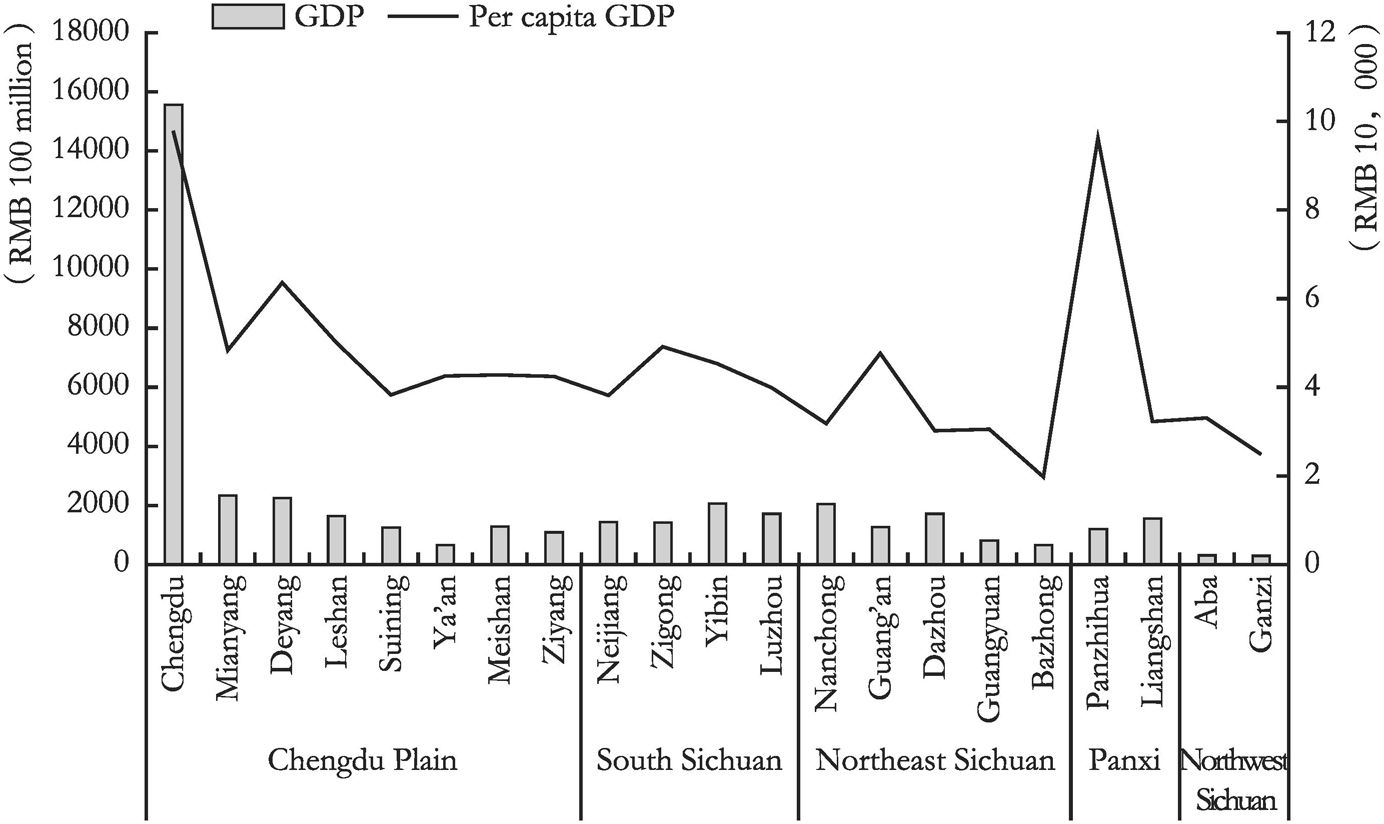
Figure 6 GDP and Per Capita Incomes of Cities in Sichuan Province in 2018
资源编号:1141509
图表出处:国家中心城市建设报告(2019):国家中心城市建设与区域协调发展(汉英对照)(全2册) 出处详情
关键词:
所属学科:城市经济学
图表描述:
图表规格:jpg
免费查看原图 查看全文
社会科学文献出版社版权所有
同文图表查看更多>
-
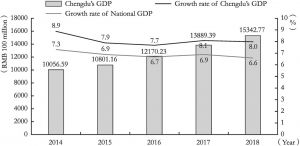
Figure 1 Chengdu’s GDP and Its Growth Rate and Growth rate of National GDP for 2014-2018
图表出处:国家中心城市建设报告(2019):国家中心城市建设与区域协调发展(汉英对照)(全2册)
-
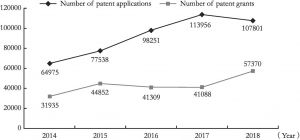
Figure 2 Numbers of Patent Applications and Patent Grants in Chengdu for 2014-2018
图表出处:国家中心城市建设报告(2019):国家中心城市建设与区域协调发展(汉英对照)(全2册)
-
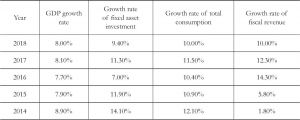
Table 1 Economic Indicators of Chengdu for 2014-2018
图表出处:国家中心城市建设报告(2019):国家中心城市建设与区域协调发展(汉英对照)(全2册)
-
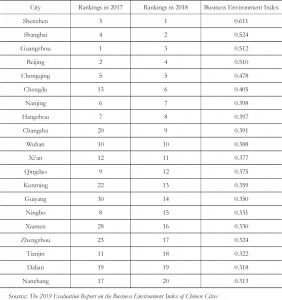
Table 2 Business Environment Index of Chinese Cities and Their Rankings
图表出处:国家中心城市建设报告(2019):国家中心城市建设与区域协调发展(汉英对照)(全2册)
-
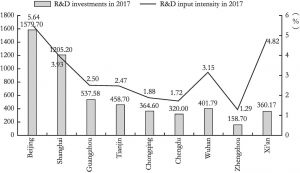
Figure 8 Total R&D Investments and Input Intensity of the Nine Central Cities in 2017
图表出处:国家中心城市建设报告(2019):国家中心城市建设与区域协调发展(汉英对照)(全2册)
