
- 分享
-
收藏(0)
查看图片上下文
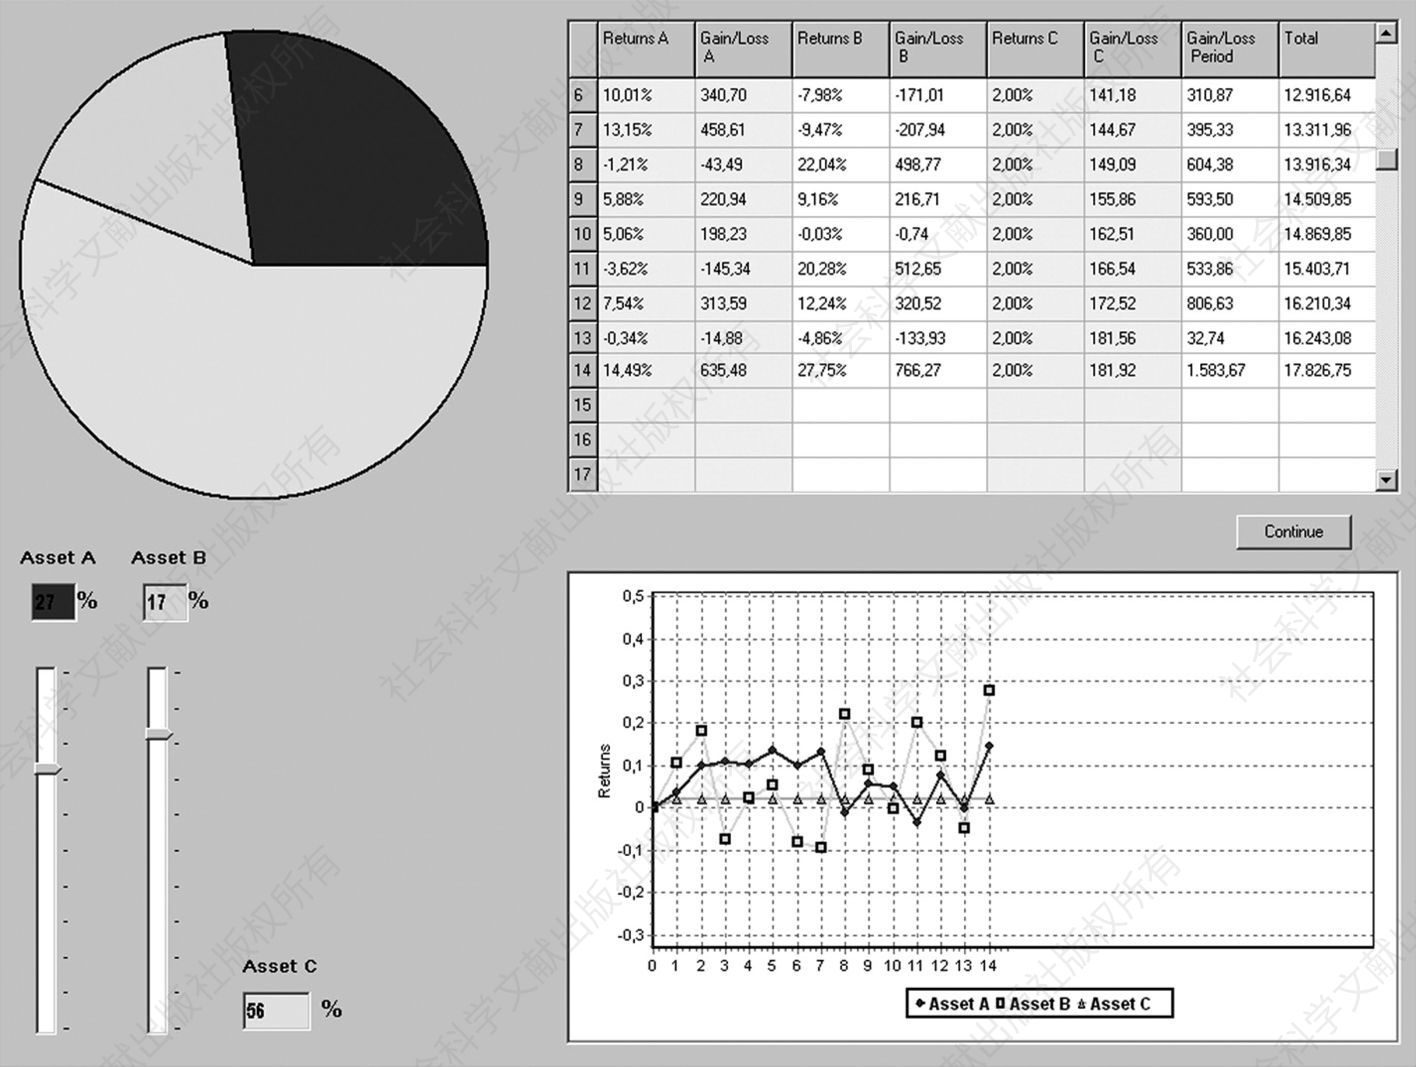
Figure 1 Screenshot of the Experimental Software Used in Experiments No.1 and No.2. Participants Made Their Decisions by Moving the Tab up and down a Sliding Rule Below Each Investment Alternative. The Pie Chart Reflected Their Investment Decisions.
资源编号:1585999
图片出处:Frontiers in Economic and Management Research (Volume 7) 出处详情
关键词:
所属学科:国民经济计划学
图片描述:
图片规格:jpg
免费查看原图 查看全文
社会科学文献出版社版权所有
同文图片
-
图片出处:Frontiers in Economic and Management Research (Volume 7)
-

图片出处:Frontiers in Economic and Management Research (Volume 7)
