
- 分享
-
收藏(0)
查看图表上下文
Table 3.3 2009-2018 China-Arab countries’ contracted turnover from
资源编号:1713788
图表出处:中阿经贸关系发展进程2019年度报告(中英文双语) 出处详情
关键词:
所属学科:国际经济关系
图表描述:
图表规格:jpg
免费查看原图 查看全文
社会科学文献出版社版权所有
同文图表查看更多>
-
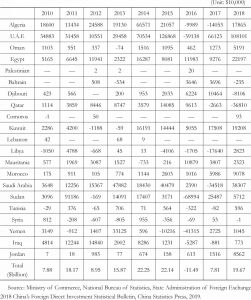
Table 3.1 Table of China’s Direct Investment Flows to Arab Countries 2010-2018
图表出处:中阿经贸关系发展进程2019年度报告(中英文双语)
-
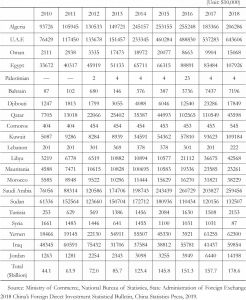
Table 3.2 Table of China’s Stock of Direct Investment to Arab Countries 2010-2018
图表出处:中阿经贸关系发展进程2019年度报告(中英文双语)
-
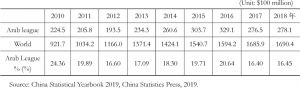
Table 3.6 China’s world and Arab League project contracted turnover from 2010 to 2018
图表出处:中阿经贸关系发展进程2019年度报告(中英文双语)
-
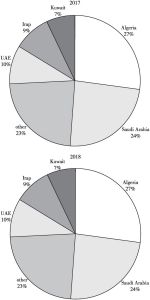
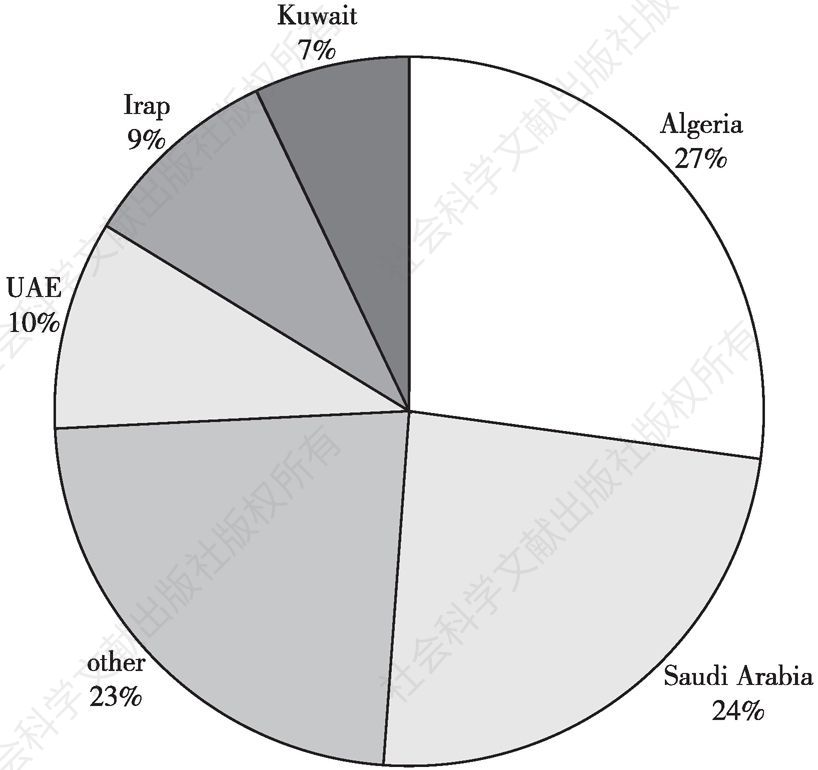
Figure 3.2 China’s share of direct investment stock in Arab countries
图表出处:中阿经贸关系发展进程2019年度报告(中英文双语)
-
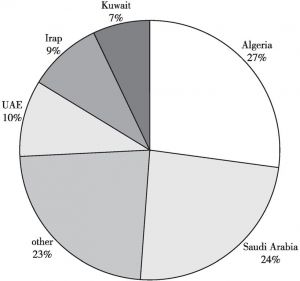
Figure 3.4 2016-2018 Proportion of China’s contracted turnover from Arab countries
图表出处:中阿经贸关系发展进程2019年度报告(中英文双语)
