
- 分享
-
收藏(0)
查看图表上下文
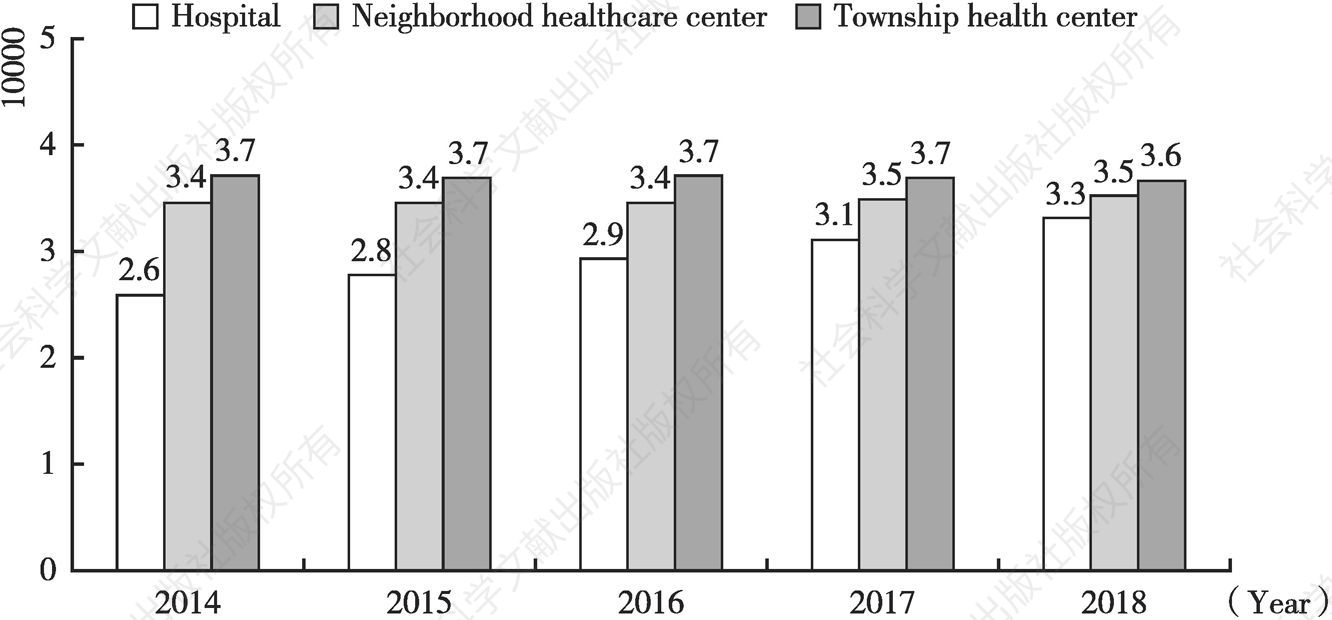
Figure 5 Number of healthcare providers nationwide (2014-2018)
资源编号:1852474
图表出处:中国城市生活质量报告(2020) 出处详情
关键词:
所属学科:城市社会学
图表描述:
图表规格:jpg
免费查看原图 查看全文
社会科学文献出版社版权所有
同文图表查看更多>
-
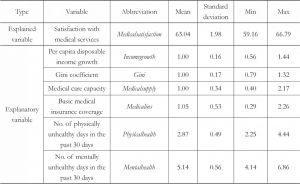
Table 5 Regression variables and descriptive statistics
图表出处:中国城市生活质量报告(2020)
-
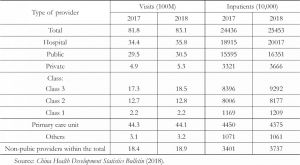
Table 7 National workload of medical services
图表出处:中国城市生活质量报告(2020)
-
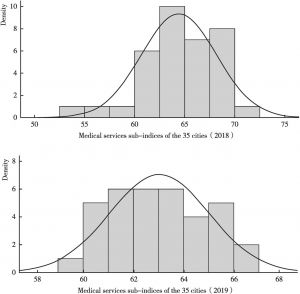
Figure 1 Histogram of medical services sub-indices (2018-2019)
图表出处:中国城市生活质量报告(2020)
-
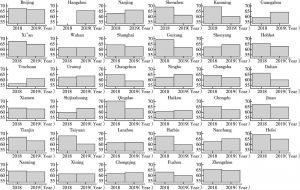
Figure 2 Changes in medical services sub-index by city (2018-2019)
图表出处:中国城市生活质量报告(2020)
-
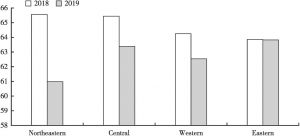
Figure 3 Changes in medical services sub-index by region (2018-2019)
图表出处:中国城市生活质量报告(2020)
