
- 分享
-
收藏(0)
查看图表上下文
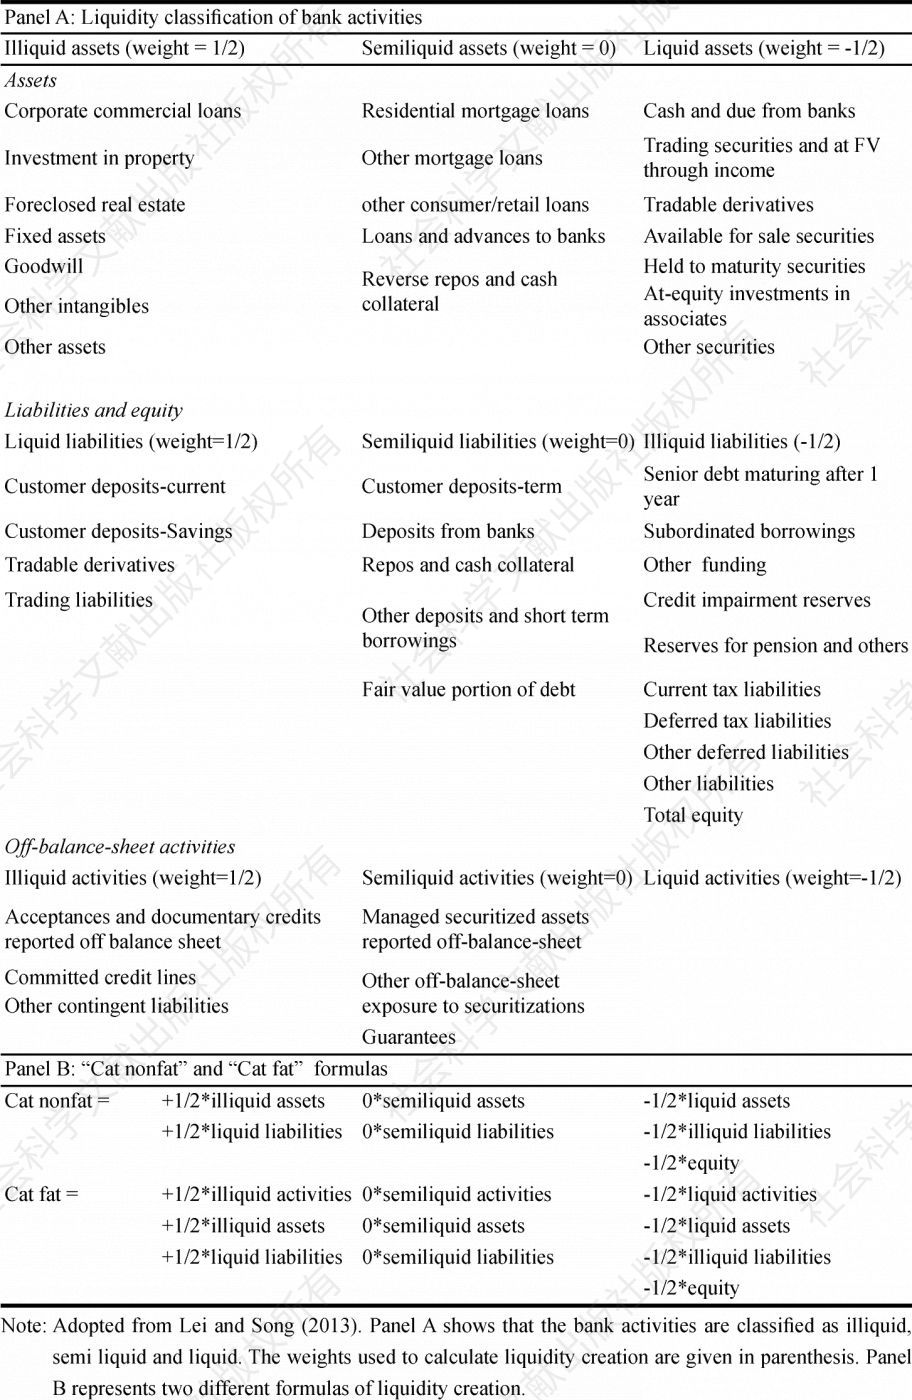
Table 1 Liquidity classification of bank activities and formulas to calculate liquidity creation of a bank
资源编号:1838398
图表出处:China Finance and Economic Review Volume 5 Number 3 Autumn 2016 出处详情
关键词:
所属学科:
图表描述:
图表规格:png
免费查看原图 查看全文
社会科学文献出版社版权所有
同文图表查看更多>
-
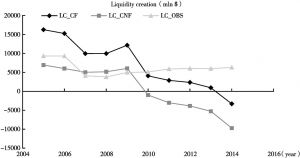
Figure 1. The aggregate amount of liquidity created by Chinese banks over 2005-2014 period
图表出处:China Finance and Economic Review Volume 5 Number 3 Autumn 2016
-
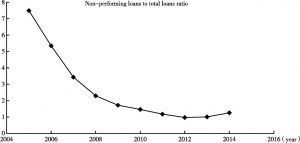
Figure 2. The aggregate ratio of NPLs to total loans over 2005-2014 period.
图表出处:China Finance and Economic Review Volume 5 Number 3 Autumn 2016
-
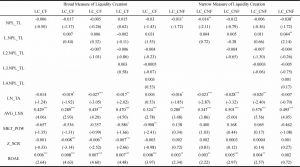
Table 4 The effect of NPLs on liquidity creation
图表出处:China Finance and Economic Review Volume 5 Number 3 Autumn 2016
-
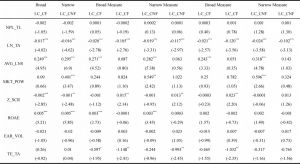
Table 5 The effect of Non-performing loans (NPLs) on bank liquidity creation
图表出处:China Finance and Economic Review Volume 5 Number 3 Autumn 2016
-
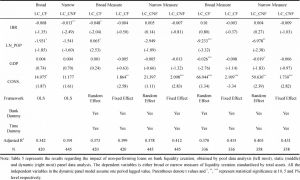
Table 5 The effect of Non-performing loans (NPLs) on bank liquidity creation-续表
图表出处:China Finance and Economic Review Volume 5 Number 3 Autumn 2016
